




Question mapping
Before building, we find out what decisions each area actually takes and what they need to see to take them.
Service
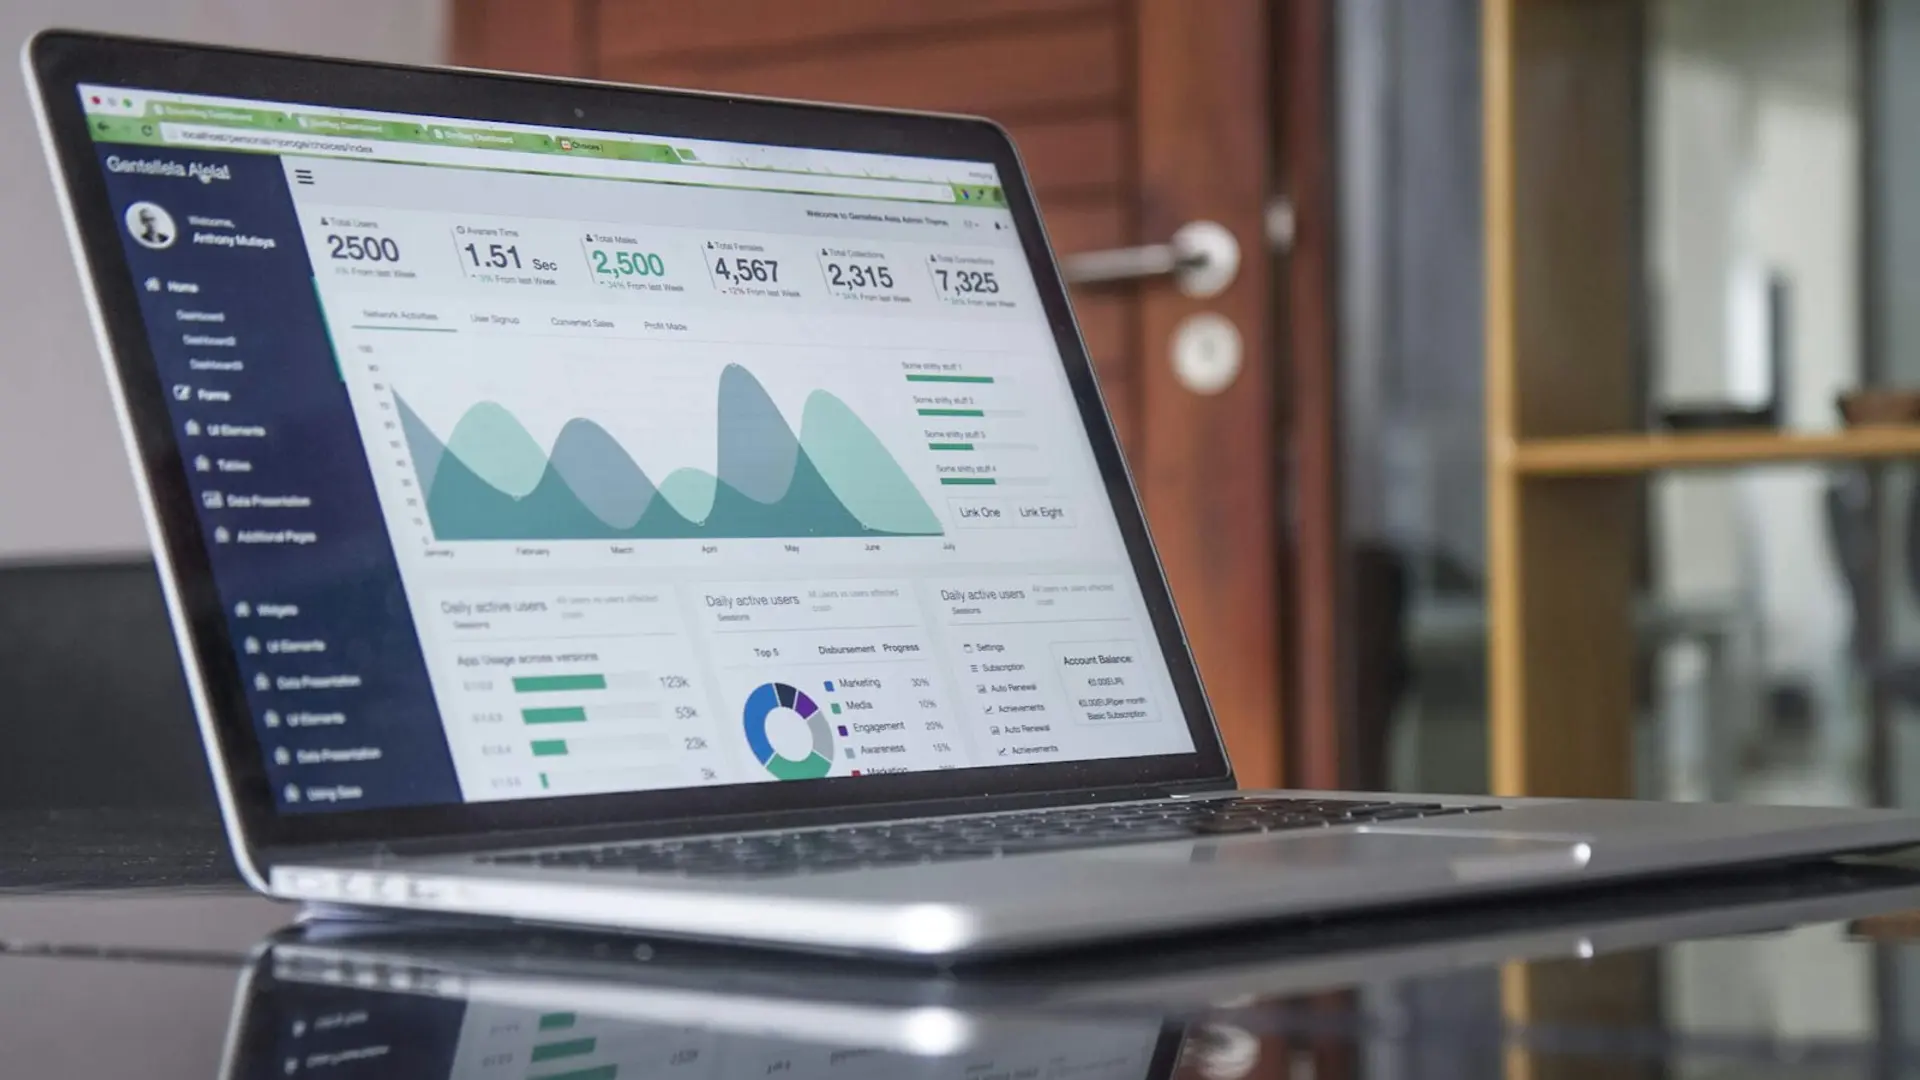
Visualisation that drives decision, not a wall of charts. Each panel answers a question somebody actually asks.


A dashboard with forty charts is usually a dashboard nobody opens. The good panel starts from the question the person needs answered on Monday morning and shows only what changes the answer.
Book a 30-min conversationDeliverables that work together or separately, depending on where your brand stands.
Before building, we find out what decisions each area actually takes and what they need to see to take them.
The top-level read for whoever needs direction and not detail, with a clear route into the detail when it matters.
A daily view for whoever runs the operation, with the metric that triggers action on the same screen as the action.
Scheduled delivery by email or chat, so the information reaches people instead of waiting for them to log in.
Notification when a metric leaves the expected range, with context on what changed.
Sessions with each area so the panel gets used, which is where most BI projects actually fail.
A clear method. A partner who stays when execution starts.
Every screen exists to answer something specific. If there is no question, there is no chart.
We cut what does not change any action. A full panel is not the same as a useful panel.
A metric without comparison or target says nothing. Every figure comes with its reference.
A panel nobody opens is a failed project, however technically correct it is.
Every panel reads from the same source of truth. No area has a private calculation.

Power BI, Looker Studio or Metabase, depending on what you already have and what your team can maintain.
With the data model in place, two to four weeks. Without it, the model comes first.
Yes. We hand over the structure and train your team. Small changes should not depend on a vendor.
Fewer than you think. Usually one executive view and one operational view per area is enough to start.
It gets integrated or stays out, with the gap made explicit. We do not build a panel on a source nobody trusts.
Yes, with each area separately. A panel only pays back when the person using it knows what to do with the number.
Tell us about your operation. We will say honestly what can be delivered and how long it takes.
Get in touchUncode Content
Audio
Long conversations about operations, AI and process. No memorized script.
Listen nowFeatured content.
Downloads without endless sign-up forms.
Coming soonWeekly newsletter
What we learn by operating, straight to your inbox. No spam, no empty hype.